

Want to win more GSA contracts and boost profitability? Start by analyzing competitor pricing. Here’s how pricing impacts your success and how to stay competitive:
- Why It Matters: Pricing affects contract awards, profitability, and compliance. Companies pricing 15%+ above market rates risk rejection.
- Key Tools: Use GSA Advantage!, CALC, SSQ+, and FPDS to gather competitor pricing data.
- Steps to Analyze:
- Compare labor rates and product prices within your SIN.
- Normalize data for accurate comparisons.
- Identify market trends, discounts, and regional price differences.
- Pricing Tips: Stay within 10-15% of market averages, avoid compliance issues, and document price changes.
Quick Takeaway: Competitive pricing isn’t just about being the cheapest – it’s about balancing costs, quality, and compliance to win contracts and grow your business.
Use the Secret Power of GSA CALC Tool
Step 1: Finding Competitor Price Data
To effectively analyze competitor pricing, you’ll need to gather data from several reliable sources. Here’s how to start:
GSA Advantage! and CALC Tool Basics
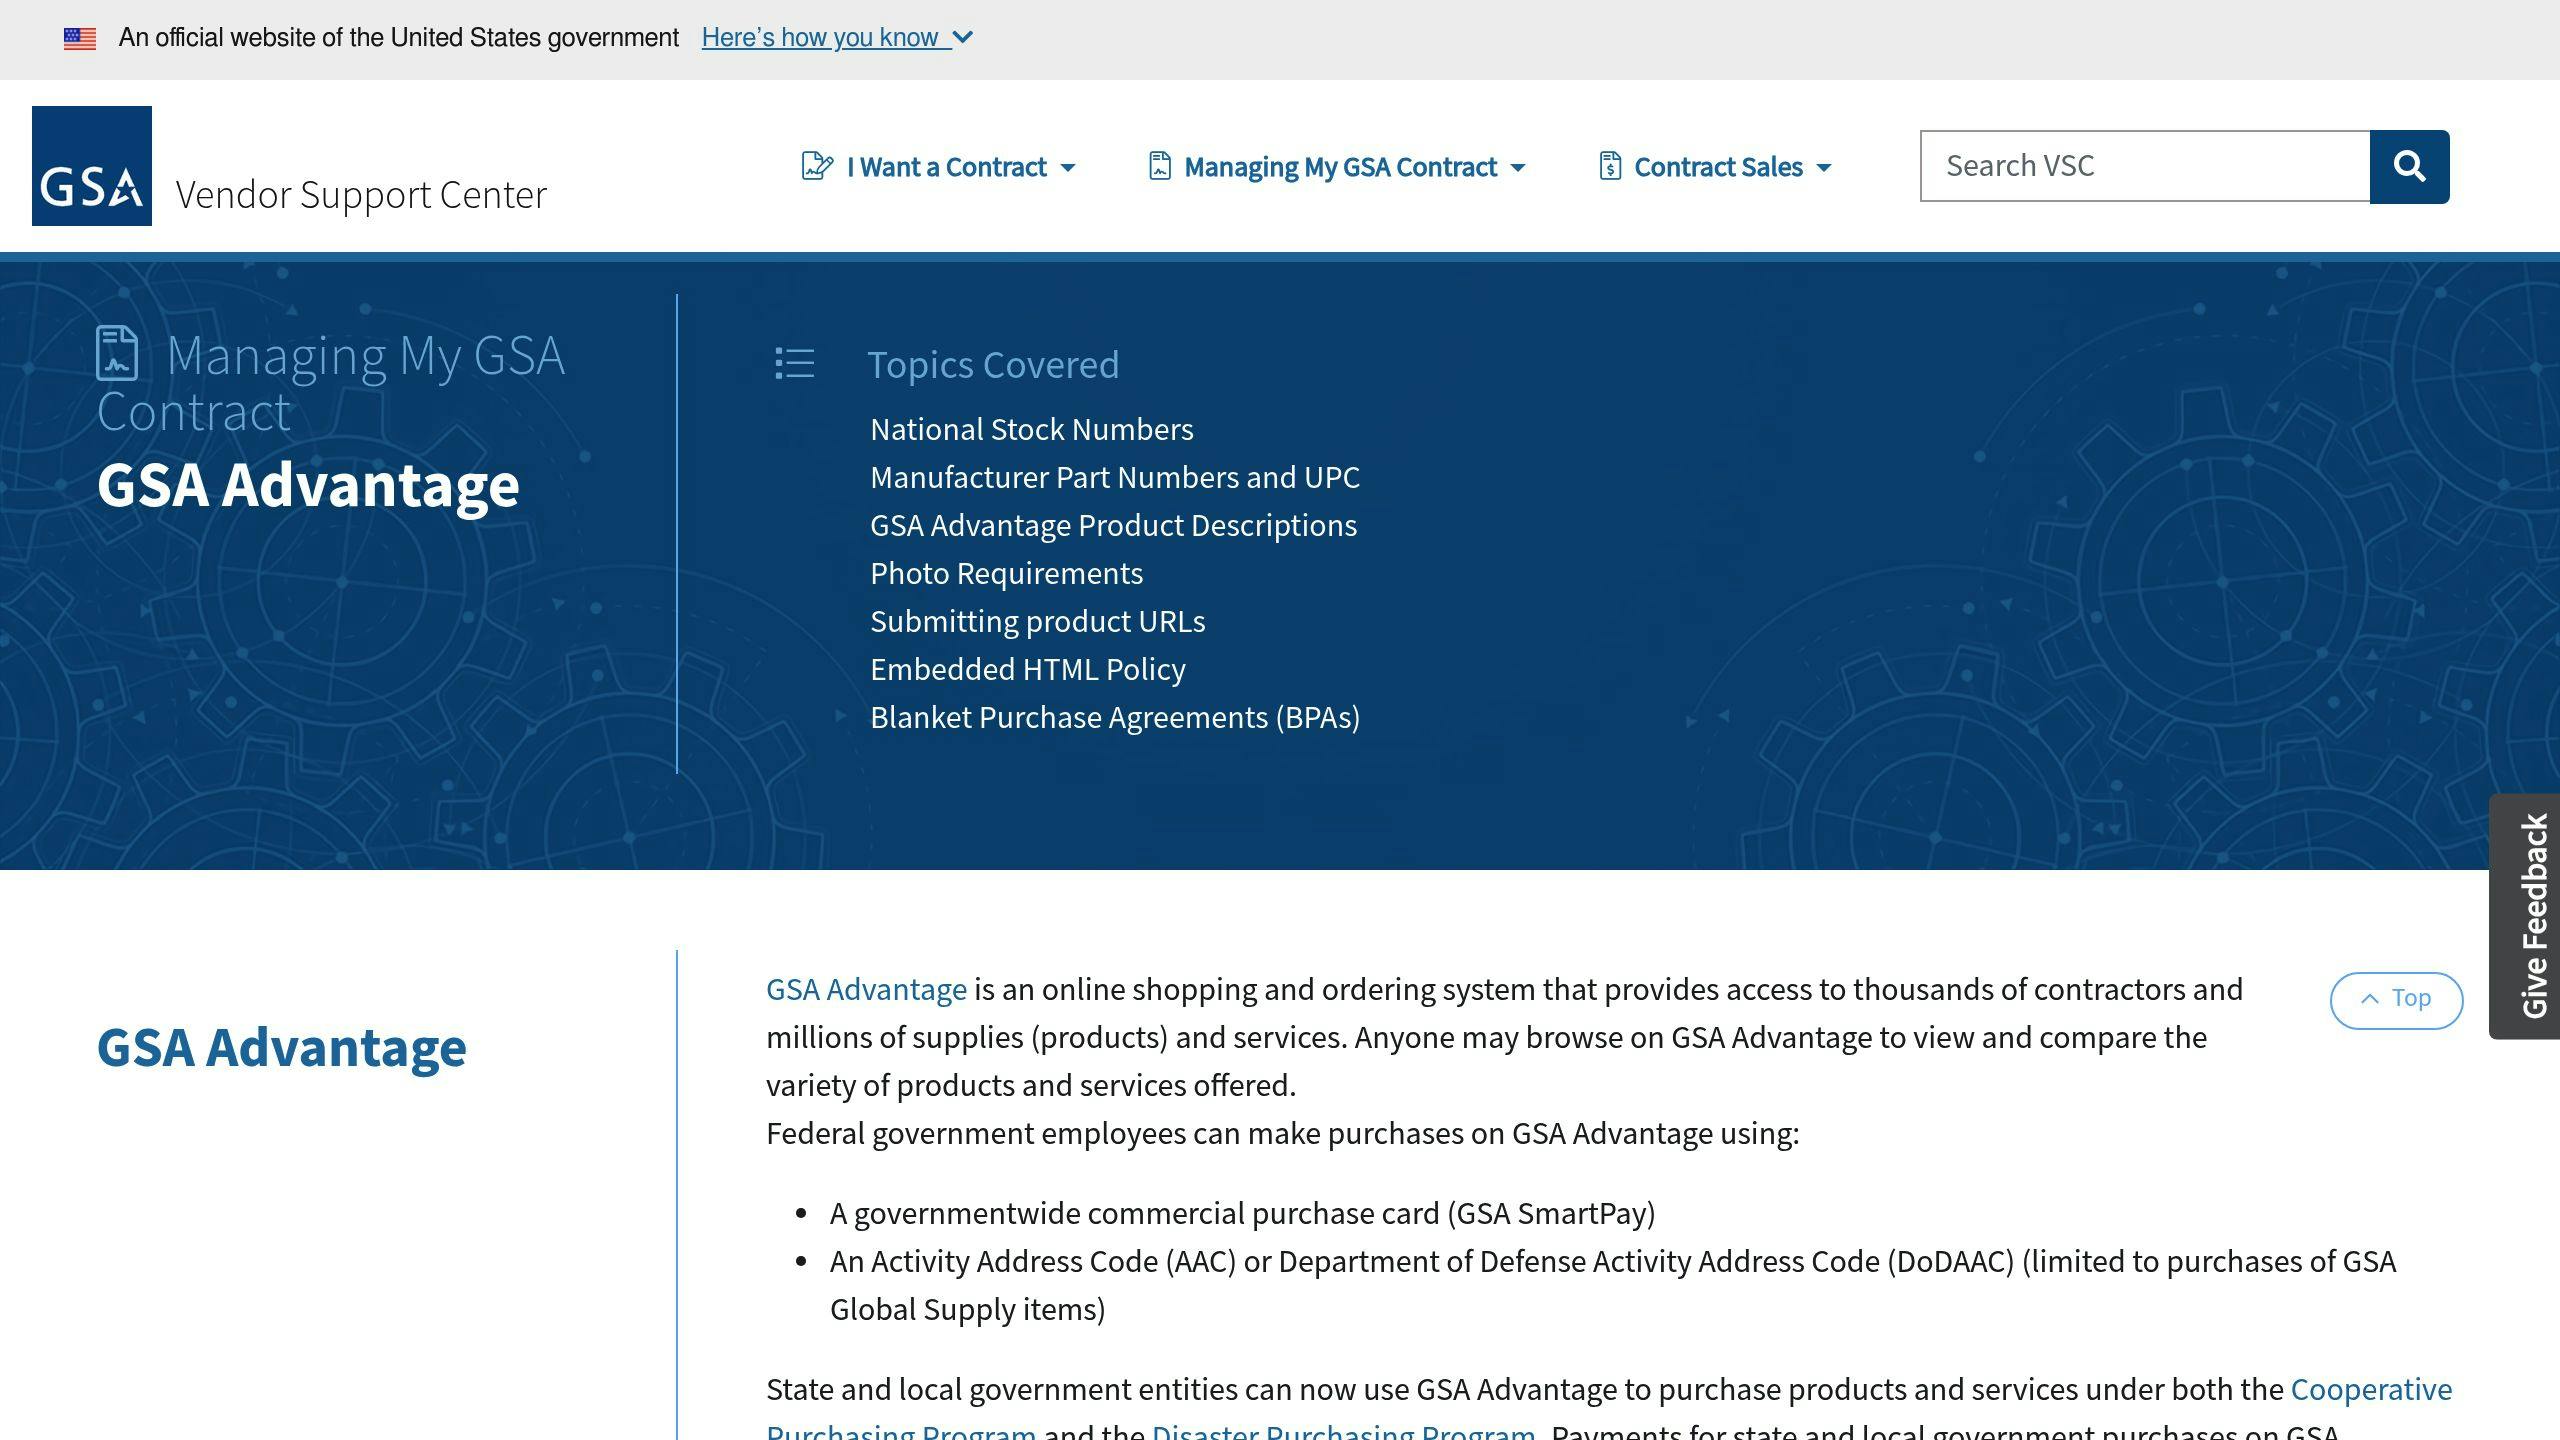
GSA Advantage! is your go-to for current contractor pricing. Focus on comparing fully burdened hourly rates for similar labor categories within your SIN classification. For example, if you’re examining IT consulting rates under SIN 54151S, narrow your search to roles like "Senior Systems Analyst III" to ensure precise comparisons [3].
The CALC (Contract Awarded Labor Category) tool is another helpful resource for aggregated pricing data. For instance, searching for "Technical Writer IV" might show an average rate of $98.75/hour, with ceiling rates reaching $132.40/hour across 23 contractors [1]. This gives you a clear idea of reasonable price ranges for similar services.
Using Schedule Sales Query+ and FPDS

Make the most of SSQ+ by following these tips:
- Use 2-year date ranges to identify trends.
- Filter results by NAICS codes to focus on relevant competitors.
- Export agency-specific reports to pinpoint key buyers.
For example, a cybersecurity contractor used trend analysis to discover that 68% of Schedule 70 IT security purchases were made by DHS components [5]. This insight allowed them to tailor their pricing strategy to appeal to this significant buyer.
Organizing Competitor Price Data
Keep your pricing data structured and easy to manage. Use cloud-based spreadsheets with version history for compliance. Track fields like:
- Contractor Name
- SIN/Product ID
- Unit Price
- Volume Discounts
- Last Update Date
- Warranty Terms
- FPDS Obligations [1]
Set weekly reminders to review prices and flag any CALC ceiling rate discrepancies over 5% [3][5]. To capture variations in terminology, use wildcards like cyber_security when searching SIN 54151H records [2].
With well-organized data, you’ll be ready to analyze market trends – covered in Step 2.
Step 2: Understanding Price Data
Price Comparison Methods
To make accurate pricing comparisons, start by normalizing your data with standardized formulas. For labor categories, calculate direct labor costs using this formula: (Loaded Rate – Fringe) / Overhead Multiplier. This approach helps you uncover the real cost beyond just surface-level rates.
For product comparisons, build a standardized matrix that includes:
- Base product price
- Extended warranty costs
- Shipping terms (FOB)
- Installation fees
- Volume discount structures
This ensures you’re comparing apples to apples when evaluating pricing.
Finding Market Patterns
Use SSQ+ location filters to analyze regional price differences. For instance, markets with fewer than three competitors often show prices that are 12-15% higher, opening up opportunities for competitive positioning [2].
Here are some common discount structures to keep in mind:
- Volume-based discounts: 5% or more for orders over $50k
- BPA-specific discounts: 7-12% for the duration of the contract
- Seasonal discounts: 8-15% during Q4
These patterns and discounts can guide your strategy while ensuring compliance with GSA’s market price standards.
Market Price Standards
To stay competitive and meet GSA requirements, your pricing should remain within 15% of the weighted average for similar offerings [5]. Focus on these benchmarks:
- Keep prices within 10% of CALC tool category averages
- Match or exceed at least three competitors on value-added features
Be aware of pricing issues that could trigger GSA audits:
- Prices that are more than 20% below commercial rates without proper documentation
- Identical pricing across multiple vendors
- Frequent price changes exceeding 10% without clear market justification [1]
Additionally, align your annual price increases with category-specific indexes, such as I-FSS-969 for IT services [3][4].
These guidelines lay the groundwork for strategic price adjustments, which you’ll dive into in Step 3.
sbb-itb-8737801
Step 3: Updating Your Prices
Cost-Plus and Market Basket Pricing
After identifying market trends in Step 2, calculate your total production costs, including materials, labor, and overhead. Add a markup of 15-20% for professional services. But don’t stop there – compare these figures to market data to ensure your pricing stays competitive.
For service contracts, a weighted market basket approach can help set rates effectively. Here’s an example of how to structure your analysis:
| Component | Weight | Sample Rate | Weighted Value |
|---|---|---|---|
| Primary Competitor Rate | 40% | $158/hr | $63.20 |
| Secondary Competitor Rate | 30% | $167/hr | $50.10 |
| Tertiary Competitor Rate | 20% | $172/hr | $34.40 |
| IGCE Benchmark | 10% | $165/hr | $16.50 |
| Final Target Rate | $164.20 |
Once you’ve determined your target rates, adjust them through GSA’s Economic Price Adjustment (EPA) process.
EPA Rules and Price Changes
Making adjustments through the EPA process requires proper timing and documentation. Here’s what you need to know:
- Adjustments are typically capped at 10% (15% for IT services).
- You must notify your Contracting Officer at least 30 days in advance [1].
For instance, a facilities maintenance contractor successfully implemented an 8% price increase in their second year by documenting rising HVAC parts costs in the commercial market [1][8]. To avoid delays, submit EPA requests at least 45 days before the planned implementation.
Common Pricing Mistakes
Pricing errors often stem from poor documentation or timing. According to GSA Focus auditors, 62% of corrective action plans are due to incomplete price change documentation [3].
To avoid these pitfalls, monitor these key metrics every month:
- Commercial vs. GSA Price Ratio: Keep this ratio at 1:1 or lower. If deviations occur, document them thoroughly.
- Discount Structure Validation: Ensure order discounts align with MFC (Most Favored Customer) commitments.
- Price Change Documentation: Maintain detailed EPA audit trails, especially for CSP (Commercial Sales Practices) disclosures during discount changes [1][8].
Late notifications can lead to serious consequences, like contract termination or financial penalties of up to 20% of disputed amounts [1]. Use FPDS data to confirm actual awarded prices, not just ceiling rates. By keeping these metrics in check, you can stay compliant and competitive, both of which are essential for long-term success under the GSA Schedule.
These pricing adjustments wrap up the analysis cycle, setting the stage for ongoing strategy improvements.
Getting Expert Help
Why Professional Analysis Matters
While some contractors manage pricing adjustments on their own, many find that professional analysis can make a big difference, especially when navigating complex EPA rules and regional market variations (as noted in Step 2). Experts use GSA tools alongside commercial market data to uncover pricing patterns that might otherwise go unnoticed. This approach often leads to 12-18% margin improvements by aligning labor category pricing with CALC tool benchmarks [3].
Another major advantage is reducing risk. Professional services help contractors avoid costly compliance issues, such as violations of the Price Reduction Clause, which average $27,000 per incident [4]. These services also monitor commercial pricing changes across customer classes, ensuring alignment with GSA requirements within the mandatory 15-day window [1].
Experts go beyond basic tools by applying advanced methods, such as:
| Analysis Component | Purpose | Impact |
|---|---|---|
| CALC Peer Benchmarks | Establish baselines | Validates pricing |
| Regional Price Mapping | Identify trends | Optimizes strategy |
| Historical Bid Patterns | Track successful bids | Improves outcomes |
| Service-Level Adjustments | Match service complexity | Justifies higher rates |
How GSA Focus Adds Value
Specialized providers like GSA Focus streamline this process further. Their team uses automated tools to monitor competitor pricing and optimize strategies. For example, they analyze GSA Advantage! product listings with change detection alerts and generate SSQ+ reports every 72 hours. This enables faster detection of pricing changes.
GSA Focus also excels at securing better EPA terms during contract modifications. By using comparative analytics, they’ve justified EPA rate increases beyond the standard 10% cap. In one case, they successfully argued for a 14% EPA rate increase by showing evidence of similar commercial market trends [1][5].
The benefits of these services often outweigh the costs. Contractors typically recoup their investment within 4-6 contract wins [2][4]. This is due to the competitive edge gained from data-driven pricing strategies, which not only improve margins but also help secure more contracts.
Conclusion: Improving Your GSA Price Strategy
After making data-driven pricing adjustments, it’s crucial to maintain your edge by focusing on these key principles:
Tips for Small Businesses
Build on the competitor analysis from earlier steps by:
- Keeping an eye on annual escalation trends, which typically range between 2.3-2.5% per year [1][3].
- Including competitor perks like warranty terms and service options in your strategy.
- Conducting quarterly performance reviews, which have been shown to boost contract renewal rates by 23% compared to annual reviews [1][7].
Your competitor analysis should highlight crucial metrics, such as price competitiveness compared to CALC category averages and changes in your quote-to-win ratios after adjustments [3].
Steps to Start Your Price Analysis
Kick off your analysis with these actions:
| Action | Source | Purpose |
|---|---|---|
| Compare ceiling rates | CALC+ | Establish baseline pricing |
| Review competitor listings | GSA Advantage | Understand market positioning |
| Analyze recent awards | FPDS.gov | Spot industry trends |
If you’re facing complex pricing issues (like a variance of more than 15% from IGCEs), consider seeking expert guidance [6][3]. The goal is to strike the right balance between staying competitive and ensuring profitability, all while adhering to GSA standards.
Related Blog Posts
- GSA Price List Update Success Stories
- How Value-Based Pricing Impacts GSA Contracts
- Top Tools for GSA Competitor Research
- GSA Negotiation Objectives Explained